IntexReport
published by Hannah Southwick
Want to create a visual like this?
Get Started- Blog
- Resources
© 2025 Piktochart.com, Piktochart LLC. All Rights Reserved.
- Privacy Policy Terms of Use Cookie Policy

12.01.2021
Opioid
Crisis
System Proposal
OPIOID TASK FORCE CONSULTING
HANNAH SOUTHWICK
JAKE LEBARON
JOSHUA GARDNER
JIALING LU
I. Background Information
Executive Summary
Crisis Summary
II. Business Case
Problem Description
Project Scope
Feasibility Analysis
III. Existing System Overview
Existing System Description
Existing Data Structure
Data Cleaning
IV. System Proposal
System Overview
System Requirements
Website
Database
Models
Diagrams
Implementation Plan
Agile Methodology
VI. Appendix
-------------------------------------------------
--------------------------------------------------------
-------------------------------------------------------------
-----------------------------------------------------------
------------------------------------------------------
--------------------------------------------------------------
---------------------------------------------------------
-----------------------------------------------
------------------------------------------------
-----------------------------------------------------
------------------------------------------------------------
--------------------------------------------------------
-----------------------------------------------------------
------------------------------------------------------
------------------------------------------------------------------
----------------------------------------------------------------
------------------------------------------------------------------
--------------------------------------------------------------------
-------------------------------------------------------
-------------------------------------------------------
----------------------------------------------------------------
2
2
3
4
4
4
5
5
6
6
6
9
9
9
9
14
15
20
22
22
25
TABLE OF CONTENTS
1
The Opioid Task Force is more than aware of the toll that accidental opioid overdose takes on a community. Statistics highlighting the number of people who die every day from opioid-related drug overdose float around in an attempt to raise awareness, caution, and compassion. The Utah Opioid Task Force defines its purpose and adjectives as “combine resources, intelligence, and power to more effectively engage the heroin/opioid threat in the state of Utah." Our proposed project aims to better the task of raising awareness, caution, and compassion through a user interactive portal designed specifically for drug prescribers and relevant governmental agencies. With our implemented project, interested users observe, analyze, and interact with the data about all drugs prescribed (not exclusively opioids) by any prescriber in the United States as well as data about individual prescribers as they seek to more effectively engage in the heroin/opioid threat.
BACKGROUND INFORMATION
Our portal includes preliminary analyses that provide value to the data. The data included in our project includes prescribers (national provider identifier, first name, last name, gender, specialty, credentials, state, total prescriptions, opioid prescribing status, as well as 250 drugs available to be prescribed), drugs (drug name and drug type), states (state name, abbreviation, population, and opioid deaths), as well as connecting data linking prescribers to drugs through quantity fields. These analyses are provided to strengthen and aid the analyses conducted with given classification and recommender models. Analyses were conducted through machine learning practices (using Azure Machine Learning Studio) like classification models and recommenders, database normalization and sql queries (via MySQL), and Tableau charts displaying relevant information gathered from query analyses. Relevant diagrams detailing domain class data storage structure, use cases, and activity flow will also be featured in this project report.
2
Executive Summary
According to the National Institute on Drug Abuse, opioids are a class of drugs that include the illegal drug heroin, synthetic opioids such as fentanyl, and pain relievers available legally by prescription such as oxycodone. Opioids work in the brain to produce a variety of effects, the most common being pain relief. Aside from the illegal opioid Heroin, opioids can be prescribed as medications such as OxyContin and Vicodin for pain relief and can be very effective, however, they can also lead to addiction disorders. When opioids are prescribed to a patient, they are often used to block pain signals between the brain and the body. Moderate to severe pain can be treated by opioids. Opioids can be highly addictive and they’re dangerous if used inappropriately. They can make people feel relaxed and happy and that’s a tempting reason for some people to misuse them aside from medical needs. There have also been cases where a patient was taking prescribed opioids and accidentally took too much and got addicted. Since opioids can be highly addictive when misused, the addiction doesn’t always happen intentionally. Regular use of prescribed medications can increase one’s tolerance and dependence. Patients may find themselves needing higher and more frequent doses. Opioids can restrict one’s ability to breathe when taken at a higher dose. The danger of opioid misuse is overdose which occurs because opioids can cause bad reactions that make your breathing slow or even stop. This can happen if your body can't handle the opioids that you take that day. Combining as many resources about the opioid crisis as possible is another step forward in the betterment of lives and communities.
BACKGROUND INFORMATION
3
Crisis Summary
We’ve been given relevant opioid data from an organization that assists in enhancing more awareness of the community. We have analyzed the information to the best of our ability and created a prototype website that provides information for people who are associated with this crisis.
The opioid crisis has been causing a massive impact on American society. The reason is because of the high amount of deaths caused by opioid overdose. Misuse of opioids can lead to a fatal overdose. The opioid crisis is now a public health emergency. In 2017, there was a total amount of 70,237 overdose deaths due to opioids, a new high for the opioid crisis. In order to combat this problem, resources need to be combined. Our system is just one step that can be taken that can lead to other steps, inspiring change and well-being.
The opioid crisis needs more attention from the public and a system which the users can interact with to search for and update information. We created this system to aid the work of the drug prescribers (including doctors, physician assistants, nurse practitioners, and anyone else with a license to prescribe) and the relevant government agencies such as the U.S. Department of Health and Human Services (HHS) and the Center of Disease Control(CDC). Our project provides more in-depth information on different kinds of opioids and the associated prescribers.
BUSINESS CASE
4
The portal that we’ve compiled consists of five main parts. The first part is a landing page for the website which provides the information and interacts with the users. The second part is two search functionality views for prescribers and drugs. The search functionality view for prescribers allows the users to search for the prescribers according to the name, gender, credentials, location, and specialty. The search functionality view for drugs allows the users to search for drugs according to the name and whether or not it’s an opioid. The third part is two detailed view pages for the prescribers and drugs. These pages are rendered as a drug or prescriber is searched. These detailed view pages display
Project Scope
Problem Description
connecting information between prescriber and drug for further analysis. For the prescriber page, the prescriber’s name, gender, credentials, location, and specialty is displayed. The fourth part is a mange prescribers page which allows the user to create, read, update, and delete prescribers from the database. This functionality also includes the ability to update the total prescriptions for each prescriber. The fifth part is the analyses which contains statistics and relevant analyses gathered from queries and tableau analytics. This fifth part of the portal will be discussed later in the report.
5
BUSINESS CASE
Feasibility Analysis
For economic considerations, this project was done by a consulting team of 4 individuals in affiliation with the Information Systems department of Brigham Young University, Marriott School of Business. This project was able to be done without funding as the data and information needed for the project was attained to us with no cost. The tools were accessed through discounted accounts and trials. If further progress is to be made with this project, it is proposed that subscriptions and accounts be purchased for ensured continued success. The project proposal was estimated to have taken around 80 hours while the project implementation will take an estimated 435 days. For technical considerations, the majority of the technical skills required for this project were attained through familiarity with python/Django, sql, html/css, bootstrap, excel automation (VBA), machine learning, normalization, unified modeling language diagramming techniques, and PostgreSQL. For legal considerations, the project abides by the laws and aims to assist government agencies and healthcare providers.
The database we propose follows the structure of a unified modeling language domain class diagram. This diagram will be analyzed and explained in later parts of the project, emphasizing data storage and relevance.
The existing system structure is based on sql scripts retrieved from an outside source. The data utilized in analytics, portal prototypes, models, and diagrams were taken from this outside source and shortened significantly to benefit development and implementation for our new system proposal. A noted issue with the existing system includes the data structure and lack of normalization. This aspect of the existing system will be discussed in more detail in the following section.
6
EXISTING SYSTEM OVERVIEW
Existing System Description
As mentioned, the data and information accessed for this system were obtained from an organization familiar with the opioid crisis. The structure of the system includes a “pd_prescriber” table and a “pd_drug” table that are linked via a “pd_triple” table through associated primary and foreign keys. The “pd_prescriber” table includes the use of the national provider login attribute as a natural primary key, first name, last name, gender, state, credentials, specialty, a boolean field clarifying if the prescriber is an opioid prescriber, total prescriptions, and a list of 250 available prescribable drugs. Please note that the fields for each of the 250 drugs in the “pd_prescriber” table are processed as an integer indicating 0 if the prescriber has not prescribed that drug or a positive integer indicating the amount they have prescribed. These drugs are listed in alphabetical order and we have maintained the alphabetical order in our proposed system implementation.
Existing Data Structure
DATA CLEANING
During the data cleaning process of the data for the existing system, one of the problems encountered with “pd_prescriber” table was that the data was not normalized. It was vital that the information be normalized as we continued with data structure, analytics, etc., because normalization helps to minimize data redundancy and also ensure
that each table contains only related data. This process of normalization also prevents any future issues stemming from database modifications such as our create, read, update, and delete automation process included in the fourth part of the portal prototype (as addressed in section II of this report).
7
EXISTING SYSTEM OVERVIEW
Identify non-atomic attributes
Within the attribute, standardize the values to be comparable
Use excel automation(VBA) to break apart each entered field to be standardized by removing separating characters (‘,’,’ ‘,’-’,’’)
Review appropriate fields by cross-referencing trusted sites, validating the data
Use excel automation again to re-combine each field into one field under the attribute
The process of normalization that our group took included atomizing the “credentials” attribute. This attribute included values such as “MD”, “OD”, “NP”, etc. for each of the prescribers in the “pd_prescriber” table. Please note that 150 prescribers in the pd_prescriber table do not have credentials listed (credentials are NULL). One issue was that the values for this attribute were user entered, meaning there was not standardized syntax for credentials. Several instances for prescribers included “MD” as well as “Medical Doctor”. Another issue with atomization in this table is that over 280 prescribers were listed with more than one qualifying credential, such as the string “MD, OD, NP” listed as the credentials for one prescriber, however, this process of multiple credentials also did not have standardized syntax and there are several instances of prescribers with credentials separated with commas, spaces, dashes, or nothing at all. The rules of first normal form of normalization states that every attribute is atomic with no repeating groups.
The process that our group took was to first make the credentials uniform in terms of how the credential displays. For example, “NP” instead of “Nurse Practitioner”. This process was done in a CSV file of the “pd_prescriber” table and excel automation aided in the process of changing the full written credential to the official credential abbreviation. The next step was using excel automation (VBA) to break apart each entered field into separate columns so that it could be standardized by removing separating characters, i.e.
(" , ", " - ", " ", " \ "). This helped to separate each field to its atomized value. We then reviewed the fields by cross-referencing sites with information about credentials so that the data could be validated. Excel automation was then used to recombine the data from separate columns into one column under the attribute.
8
EXISTING SYSTEM OVERVIEW
NOTE: The normalization process taken is dependent on the assumption that combined credentials are different from separate credentials. For example, a prescriber A with credentials of “MD” and a prescriber B with credentials of “NP” have different credentials as well as a prescriber C with credentials of “MD,NP”. This assumption is because prescribers A, B, and C will make different inferences, analyses, and prescriptions because of their credentials and should not be broken up. The credentials of prescriber C (“MD,NP”) is treated as a third credential option, not a combination of the credentials for prescriber A and prescriber B.
The final step after the normalization process was converting the CSV file to SQL to then be uploaded to PostgreSQL (for portal use) as well as MySQL and Tableau (for analysis use).
The system we propose is composed by the prototype portal website made by Python and Django, the database created through PostgreSQL and PgAdmin, the recommender and classification prediction model created through Microsoft Azure Machine Learning Studio, and diagrams explaining how the system will work.
9
SYSTEM PROPOSAL
System Overview
System Requirements
The portal website we created is designed to have an appropriate landing page and a search functionality view page. This allows the users to search for prescribers and drugs according to the name, gender, credentials, location, and specialty of the prescriber and the name of the drug and whether it’s an opioid. The portal is designed to have two detailed views where the users search for the drugs and the prescribers and provide relevant information and analysis such as top 10 prescribers of a selected drug and all drugs prescribed by a selected prescriber. The system is designed to allow the logged in users to create, read, update, and delete records about the prescribers as well as additional analyses we’ve deemed appropriate throughout the website, mostly centered on a dashboard page.
WEBSITE
The portal website prototype is coded using Python and Django. The tools used include exception handling, OOP, Git, data structures, views, PostgreSQL, templates, URL mappings, models, and forms.
While our current portal website prototype does not incorporate a “logging-in” feature for only permitted users, we strongly recommend implementing this functionality
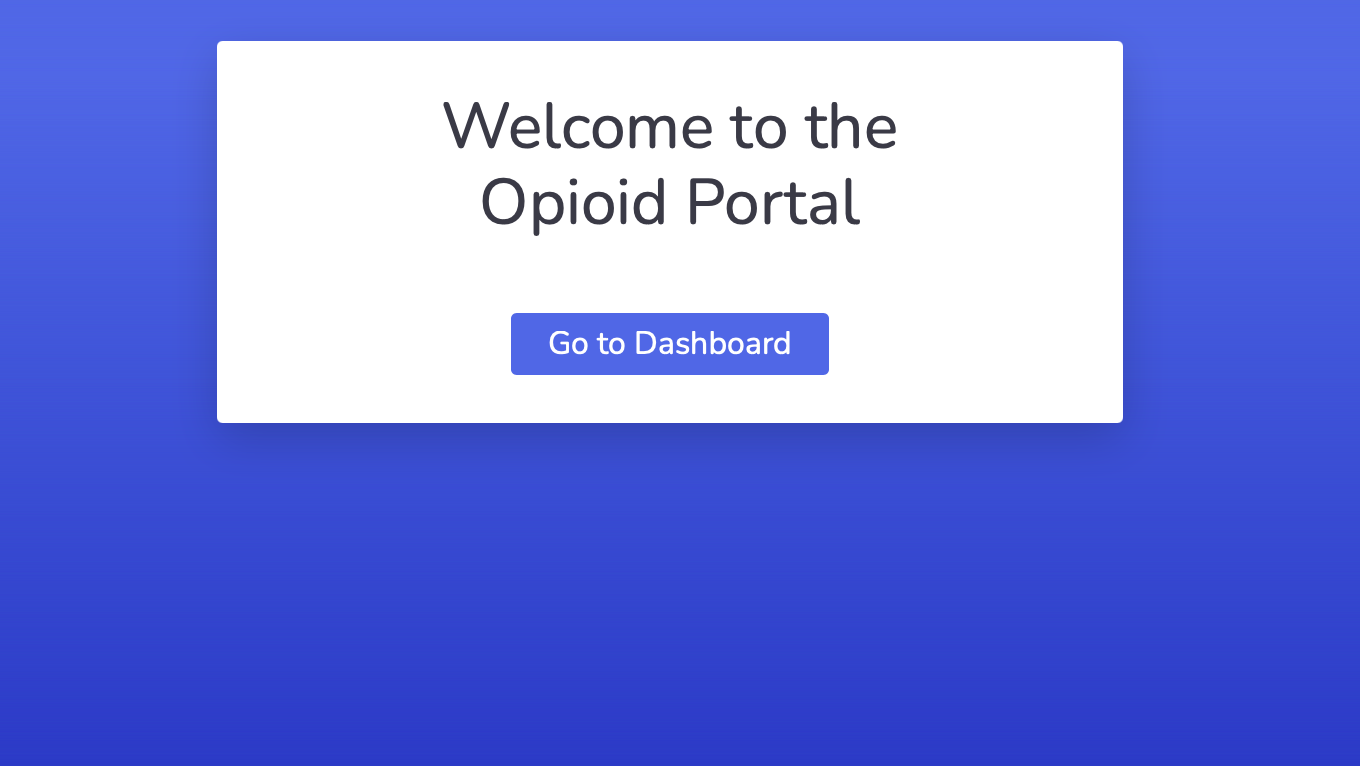
for security and documentation when this system is implemented. Included in the portal website prototype is a landing page, see figure 1 where we recommend a login feature to be implemented.
10
SYSTEM PROPOSAL
Figure 2
Figure 1
11
SYSTEM PROPOSAL
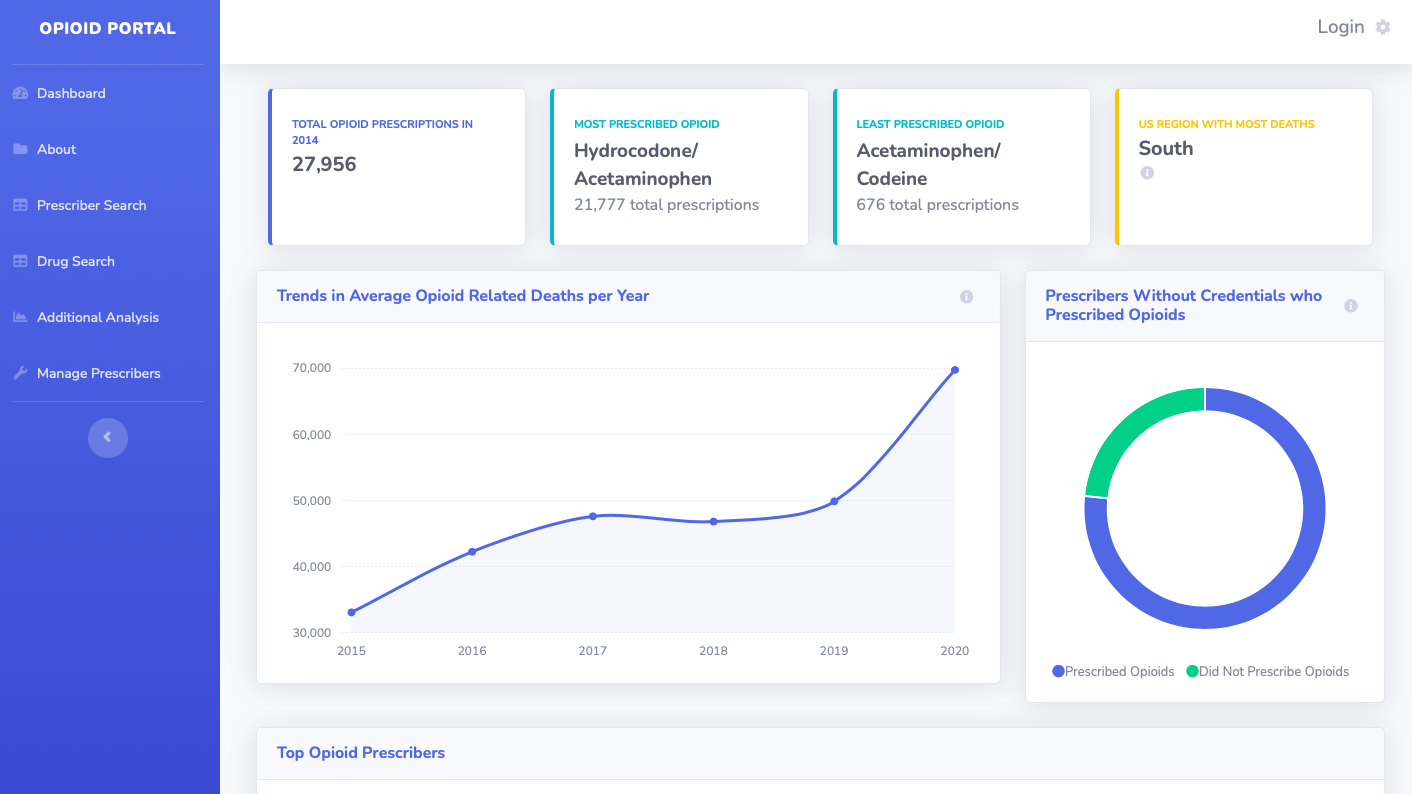
The dashboard page is the first page, aside from the landing page, that we’ve intended for the user to see. It displays a few of our analyses in a simple way to engage the user and aid in the analyses thought process (see figure 2).
Figure 3
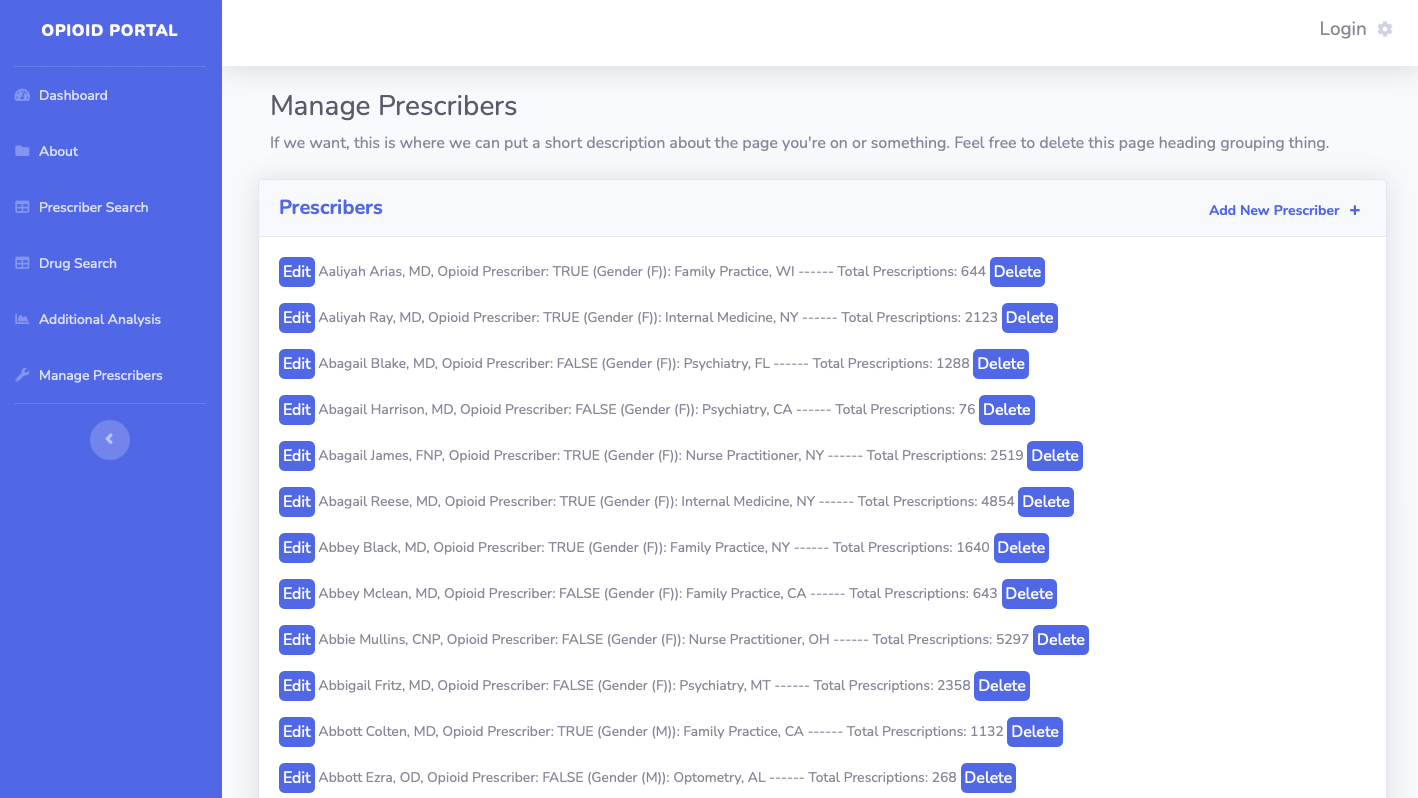
The manage prescriber page is where users will be able to create, read, update, and delete prescribers from the database (figure 3). This is done through the manage prescribers page that generates a list of all available prescribers with “edit” and “delete” buttons to the side and an “add” button at the top where when clicked, navigates to additional pages with forms for user submission. The edit page includes pre-filled input fields to edit and the system will update the records according to the user input. This page does not include the option to edit the primary key, national provider identifier.
12
SYSTEM PROPOSAL
Figure 4
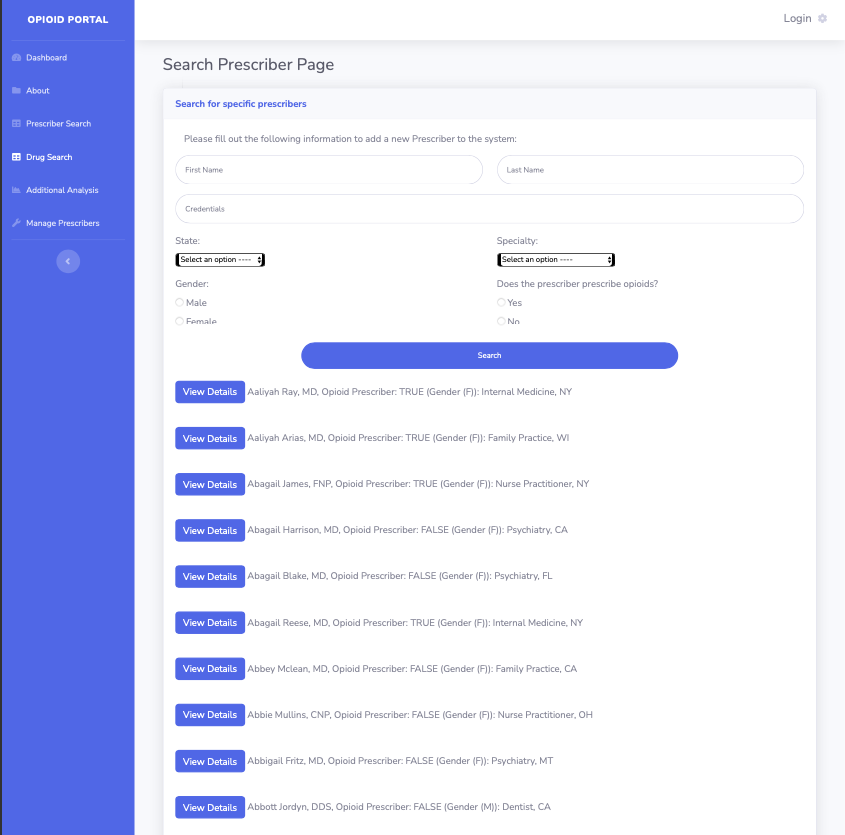
As mentioned, our portal website prototype includes search functionality for both the drug and prescriber records. For each drug, users can search on drug name and drug type. Shown in figure 4, users can search for prescriber records on at least one of the input boxes including first name, last name, state, gender, credentials, specialty, and opioid prescribing status. The opioid prescribing status and gender are radio button fields with state and specialty as dropdown selection fields.
13
SYSTEM PROPOSAL
Figure 5
Who is currently prescribing only opioids?
Who is currently prescribing high levels of opioids (compared to other non-opioid drugs)?
How many opioid drugs have been prescribed?
What opioid drug has been prescribed the most? The least?
What state has the most opioid related deaths?
What region has the highest record of opioid deaths?
How many prescribers have credentials and how many don’t have credentials?
Of those prescribers without credentials, how many prescribed opioids?
Who are the top opioid prescribers?
How many times has each specific drug been prescribed?
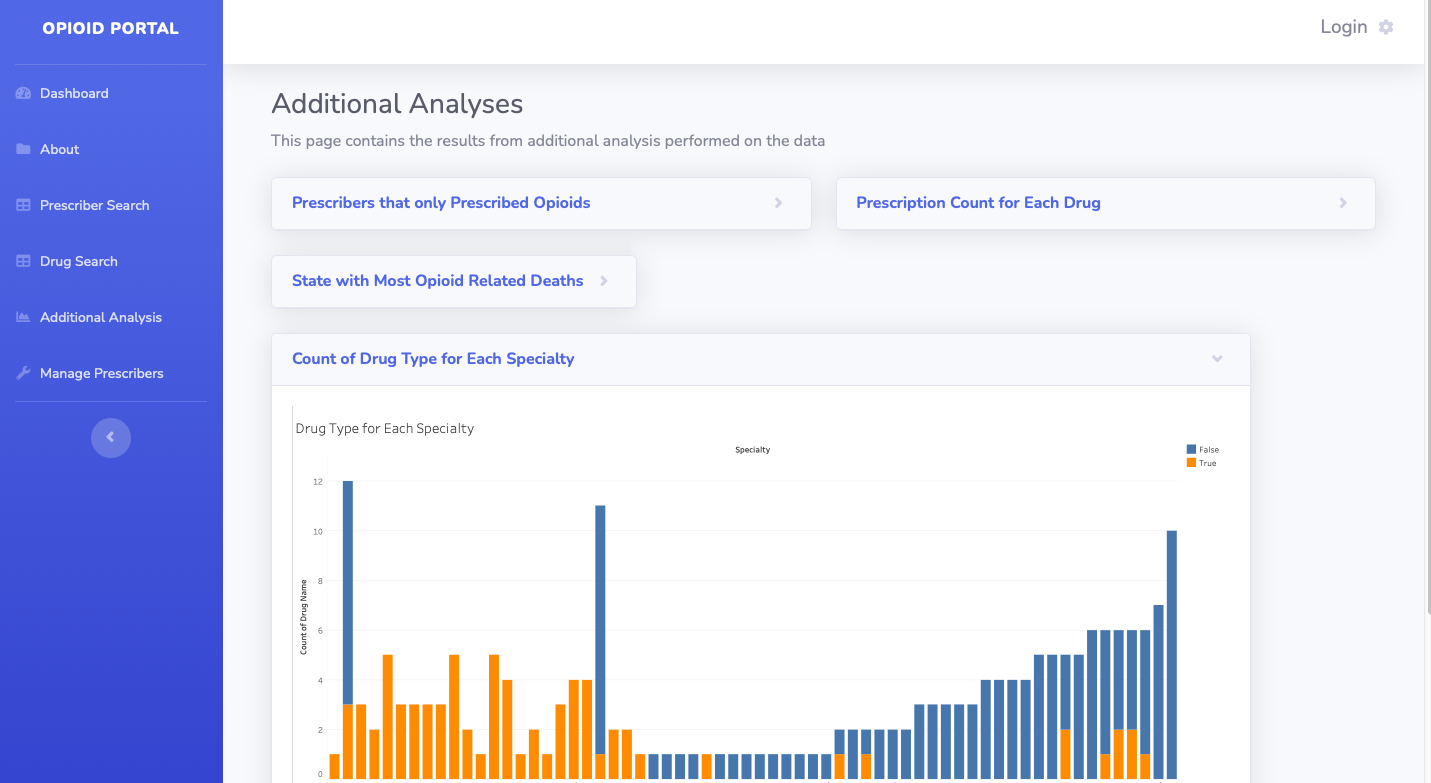
Additionally analyses are included on the dashboard page, figure 2. Conducted analyses that we deemed relevant include the following:
14
SYSTEM PROPOSAL
Answers to the above analyses and more can be found on the analyses page (figure 5) as well as the dashboard.
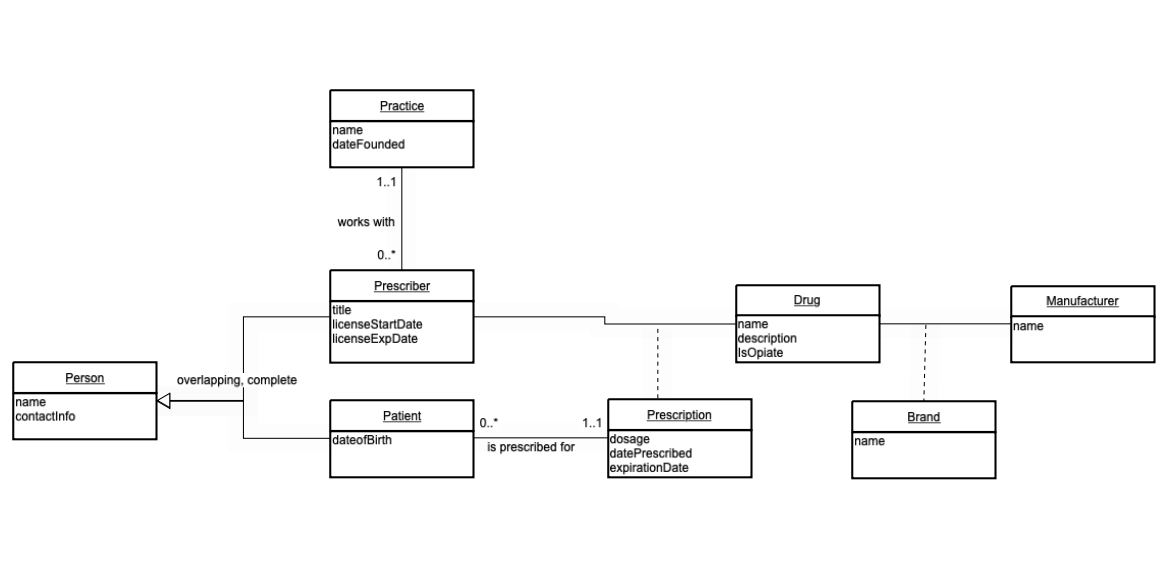
Aspects of the proposed database can be explained in figure 6 below, a UML domain class diagram. The domain class diagram displays conceptual classes and associations between conceptual classes. Our domain class diagram also shows attributes. Note: Most of these attributes will be identical to the existing system’s data structure though we have come to the conclusion that additional attributes would be helpful for future analytics, interaction, etc.
DATABASE
Figure 6
15
SYSTEM PROPOSAL
For our domain class diagram, we have eight classes. Person is the parent class for prescriber and patient. The conditions are overlapping and complete for this scenario. A prescriber works with one and only one practice though a practice can have 0 to many prescribers. The prescriber is also connected to a drug through a prescription. A prescription is connected to the prescriber where the cardinality states that a patient doesn’t have to have a prescription but a prescription has to have one and only one patient. This states that a prescriber doesn’t have to be connected with a patient, which is correct at times when prescribers can prescribe drugs for those who aren’t their specific patients. The drug class is also connected with a manufacturer through the association class brand. We felt it necessary to include these classes so we can detail the drug and prescription as specifically as possible.
For the database, we’ve created SQL “create” statement scripts for each class of the domain class diagram. Each class’s create statement includes the constraints and connections between classes. Refer to figure 20 in the appendix for an overlay of the sql scripts.
The SQL create statements can be used to create tables in the desired system to be populated later. It's important for the SQL scripts to be correct so the data can connect through the keys specified. Later models will follow the same structure as outlined in the domain class diagram
MODELS
For each model, we used data stored in PostgreSQL and accessed the data via a Microsoft Azure Machine Learning Studio flexible server and we created appropriate
16
SYSTEM PROPOSAL
datastores and datasets. Each model was created in Azure Machine Learning Studio and deployed via Postman. The JSON was then parsed in Google Collaboratory. Please note that when this project is to be implemented, an additional user interaction will need to be created in conjunction with our models for ease of use and standardization as the current demonstration is a prototype.
Classification Model
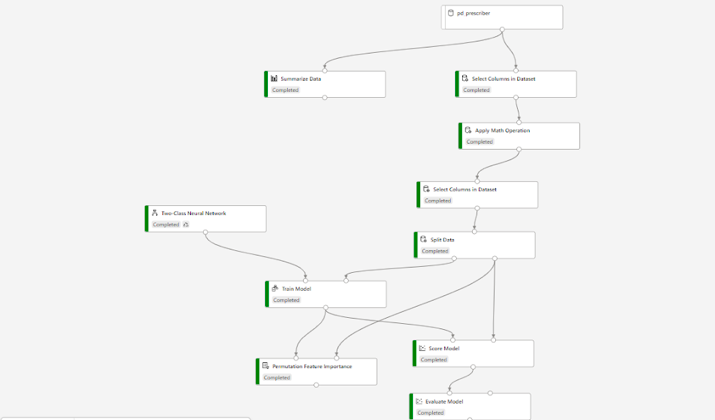
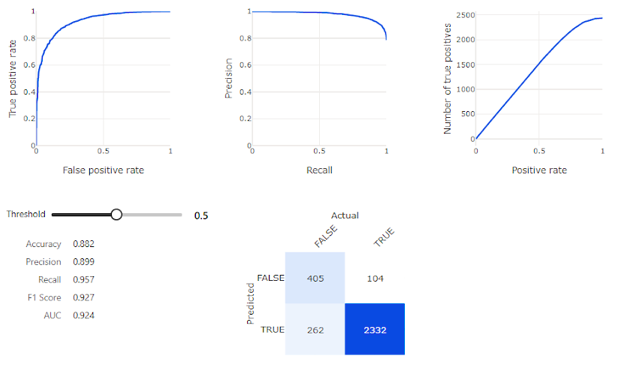
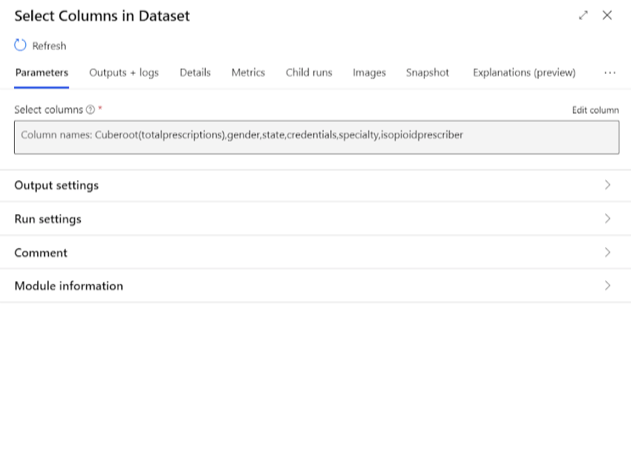
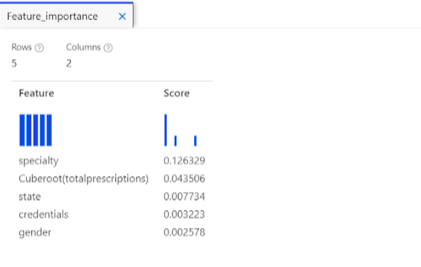
For further analysis of the data provided, we created a classification model to predict if a given prescriber will prescribe opioids or not. This includes a confusion matrix we have attached below in figure 9. We used a classification model because we were working with categorical data. This classification model takes the aforementioned pd_prescriber table and selects the columns we chose to work with, see appendix figure 16. We applied a cuberoot math transformation to totalprescriptions because the column had a moderate positive skew of 2.836. The applied math operation column is selected and then the data is split into training (50%) and testing data (50%). The model is trained using the testing data and scored using the trained data and testing data. Please note that we used a permutation feature importance pill to indicate which columns were helping the model and which were hurting the model (see appendix figure 17). When evaluated using our selected columns, we had an accuracy 0.82, precision .899, recall 0.957, see figure 9).
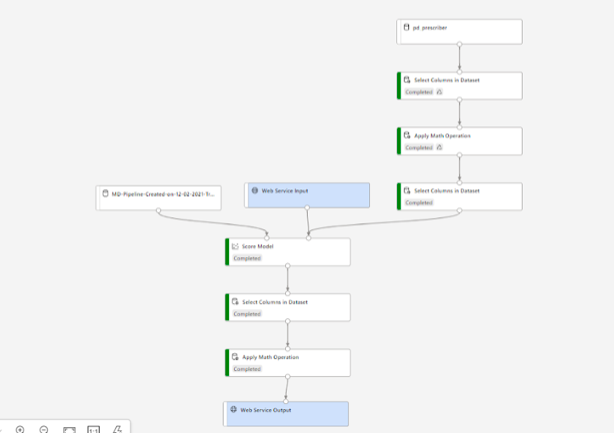
We have the web service input pill going into the score model pill. After the model is scored, we apply the reverse of the math transformed pill to get a more user friendly feature and then we selected columns with the user in mind. Then these columns feed into the web service output pill, see figure in the appendix.
17
SYSTEM PROPOSAL
Overall Classification Model ------ Figure 10
Confusion Matrix (Classification Results) -------- Figure 9
18
SYSTEM PROPOSAL
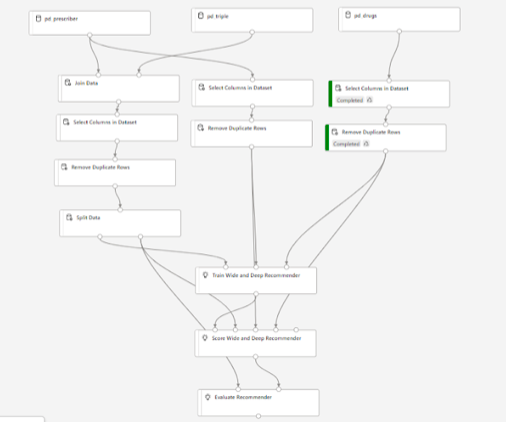
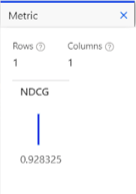
In addition to the classification model, we also created a recommender that recommends drugs for a prescriber to prescribe based on prescriber attributes that the user inputs via google collaboratory at this point in the deployment stage. In the recommender model, the first step is to take the pd_prescriber table and join it with the pd_triple table on pd_prescriber.npi = pd_triple.prescriberid where we selected columns from the pd_prescriber (npi, fname, name, gender, state, credentials, speciality, isopioidprescriber, totalprescriptions). Isopioidprescriber is the label, and the selected columns from the pd_triple table we chose for the triple include npi, drugname, and qty as the triple. We evaluated the model with all columns selected first and got an NDCG score of .926. We joined the data so we could have a more specific connection to the prescriber when recommending drugs. We added pd_drugs and selected drugid, drugname, isopioid. A remove duplicate rows for npi and drugname to remove any duplicate prescriptions, and for pd_triple we removed duplicates npi, for pd_drugs we removed duplicates for drugname. These remove duplicates pill were added to each of the datasets to ensure that the data was clean. We marked retain duplicate row as false because if there were any duplicates, we wanted to keep the recent as current as possible. After removing duplicates we split the data to 50% training and 50% testing. The model was then trained via score wide and deep recommender (default settings) and then scored via score wide and deep recommender where recommender prediction kind is item recommendation and recommended item selection is from rated items, for model evaluation. The model is then evaluated for the NDCG metric, which was .9283. This metric is better than the metric we received for all columns being selected.
Recommender Model
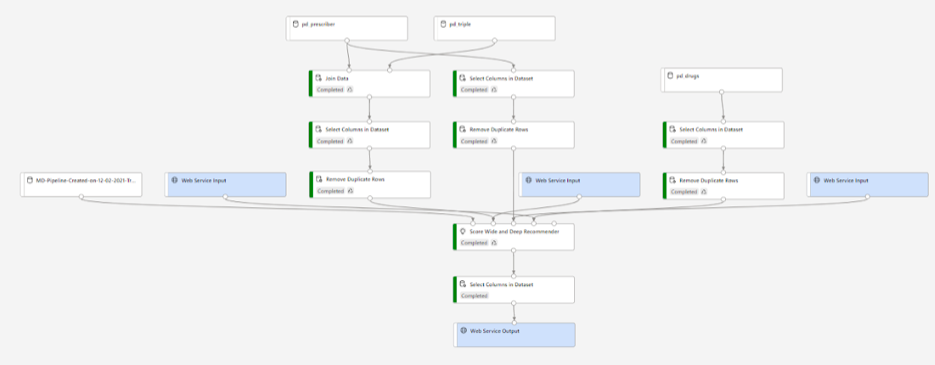
The web service inputs went into the score wide and deep recommender pill and the web service output was placed after we a select columns where we selected the recommended items 1-5.
19
SYSTEM PROPOSAL
Overall Recommender Model -------- Figure 10
Recommender Real-time Inference Pipeline -------- Figure 11
20
SYSTEM PROPOSAL
DIAGRAMS
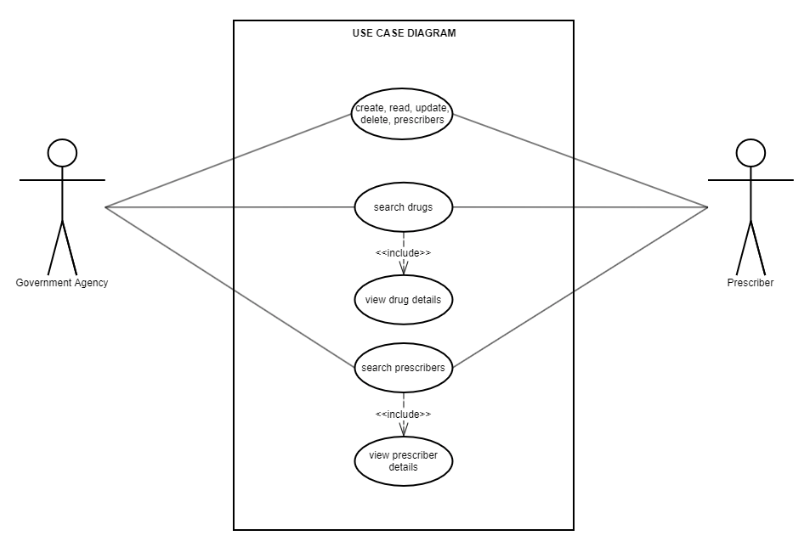
In addition to the domain class diagram representing data storage and database creation, we’ve included 2 additional diagrams that we decided would be useful in both the deliberation of implementation for this project and the actual implementation. Our first diagram here is a unified modeling language (UML) use case diagram depicting the use cases and actor interactions (figure 12). While we’ve classified similar roles for both prescribers and government agencies, we figured it was important to separate the two and we predict they will have different use cases when additional login criteria is implemented. The use cases are as follows: Create, read, update, delete prescribers, search drugs - include - view drug details, search prescribers - include - view prescriber details.
Figure 12
21
SYSTEM PROPOSAL
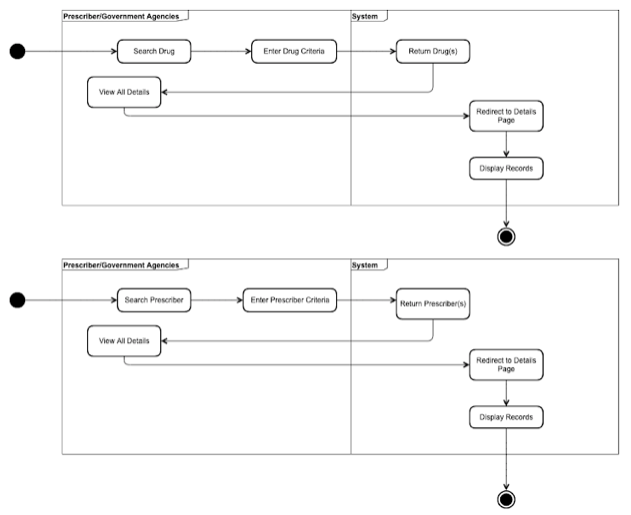
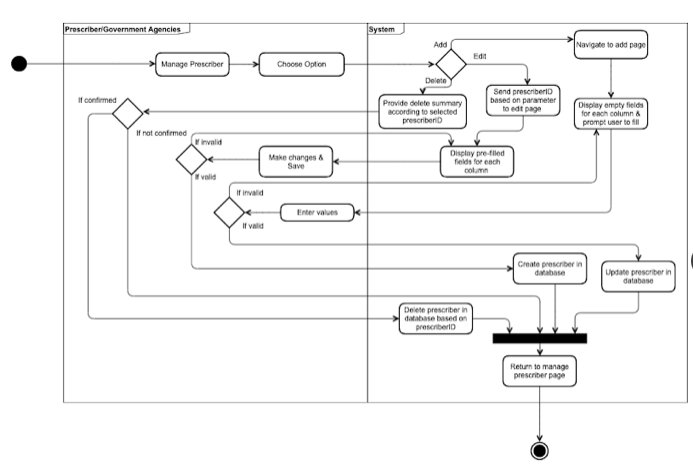
Our second diagram is an activity diagram that consists of 3 separate activities: Search Drug page in the portal, Search Prescriber in the portal, and the create, read, update, delete functionality for prescriber in the Manage Prescribers page of the portal.
Figures 13.1 - 13.3
22
SYSTEM PROPOSAL
Implementation Plan
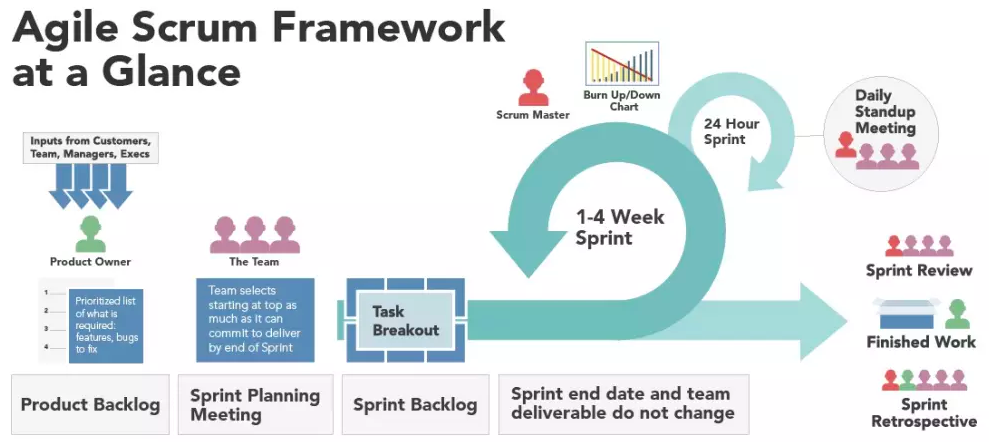
In order to ensure a smooth implementation for the proposed system, we recommend approaching the system development with Agile Methodology. Compared to traditional waterfall planning (rigid planning), agile allows for more data driven decisions, continuous improvement, and frequent feedback loops, all vital for frequent and dependable success (flexible planning). Refer to figure 14.1 and figure 14.2 for infographics summarizing agile development and frameworks.
Figure 14.1
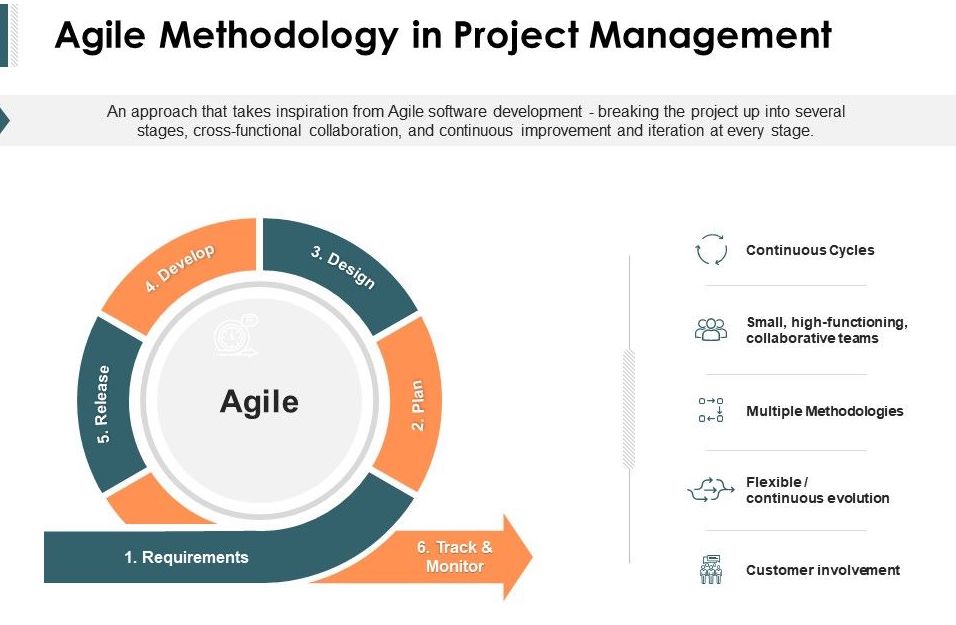
Some of the Agile Methodology principles are : Model with a purpose, build multiple models, embrace change incrementally, and communicate and learn from each other. We chose to highlight these principles because we believe they directly apply to the Opioid Task Force. Modeling with a purpose will make sure that each model is created
AGILE METHODOLOGY
23
SYSTEM PROPOSAL
successfully and precisely, which is needed with large datasets and sensitive information. Building multiple models is a principle that our consulting group has followed and we recommend the development team to continue to follow. Lastly, we wanted to highlight the communication and learning process involved with teams. It’s important to communicate with teams via understanding and compromise, especially in development. We understand development to be a critical and often difficult process. That is why we wanted to highlight important principles and recommend the Agile approach to system implementation.
As far as which Agile System Development Processes to use, we recommend scrum. This is a very popular process among developers our consulting groups associate with and wanted to highlight the process in figure 14.2. Our group has implemented extreme programming values such as communication, simplicity, feedback, and courage through practices such as planning, testing, pair programming, and refactoring code. We recommend you look into these values and practices as you move forward with implementation for the proposed system.
Figure 14.2
24
SYSTEM PROPOSAL
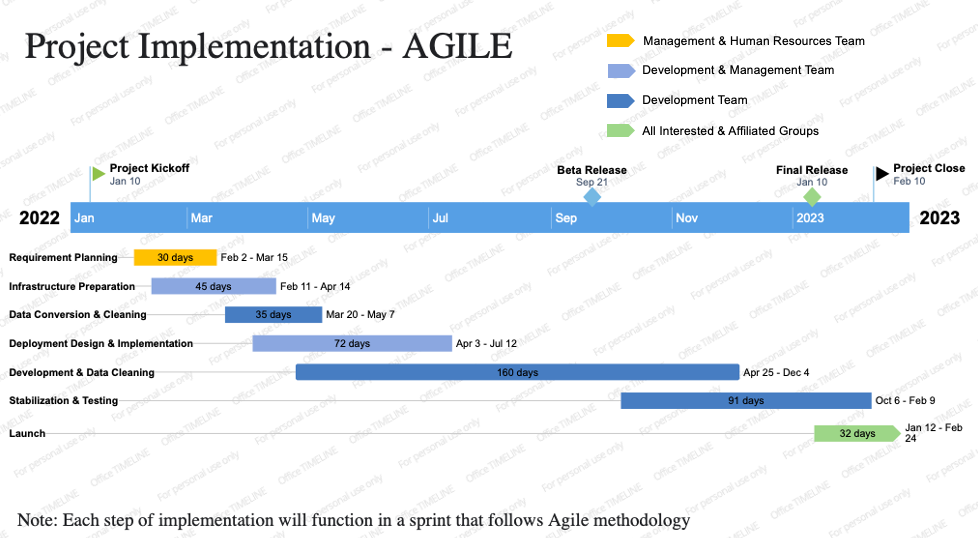
The project plan depicted below in figure 15 follows the outlined feasibility and scope in this report. Our plan also is meant to cover all areas of adjustment and features to be implemented. This plan operates under the assumption that the teams necessary for development, planning, and management continue to function with the same level of team members that they do as of January 2022. The involved parties include management, development, human resources, and all employees who interact with the current opioid database systems. All database, data science, and data collection methods are to be completed prior to implementation. This plan also assumes agile development principles, meaning that the plan, design, develop, release, track & monitor stages are present in each implementation step up to the project close.
Figure 15
25
APPENDIX
Classification Model Selected Columns ------- Figure 16
Classification Model Permutation Feature Importance ----- Figure 17
26
APPENDIX
Classification Model Real-time Inference Pipeline ------- Figure 18
Classification Model Postman ------- Figure 19
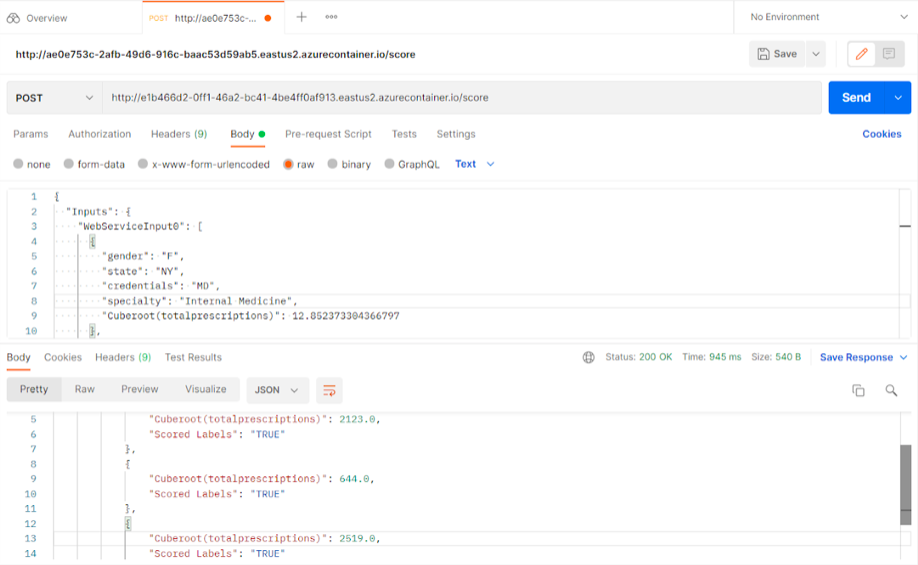
TotalPrescriptions is included in the JSON for mathematical verification
27
APPENDIX
SQL Scripts ---------- Figure 20

28
APPENDIX
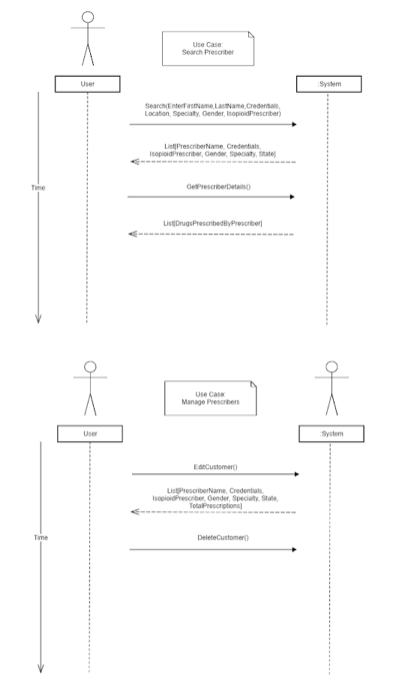
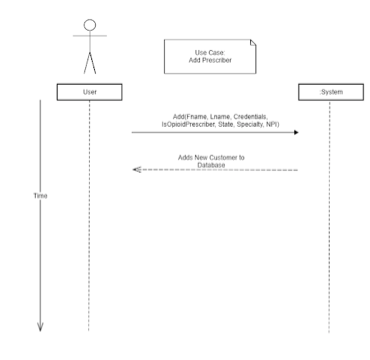
Sequence Diagrams ---------- Figures 21.1 - 21.3
29
APPENDIX
IntexReport
- Slide Preview
01
1
02
2
03
3
04
4
05
5
06
6
07
7
08
8
09
9
10
10
11
11
12
12
13
13
14
14
15
15
16
16
17
17
18
18
19
19
20
20
21
21
22
22
23
23
24
24
25
25
26
26
27
27
28
28
29
29
30
30
